Logo
ePoster
Physiology teaching and learning in a large, diverse, multi-disciplinary first semester service module: an analysis of the success rates of first year students.

Authors

  • Susan B. Higgins-Opitz
  • Mark A. Tufts

Theme

Basic Sciences and Clinical Integration

INSTITUTION

Discipline of Physiology,
School of Laboratory Medicine and Medical Sciences,
University of KwaZulu-Natal (UKZN), South Africa.

Background

 Approaches in the identification and response to Health Science students who are struggling with their studies, particularly in our context namely large, diverse and multi-disciplinary modules, are receiving increased awareness1,2,3.

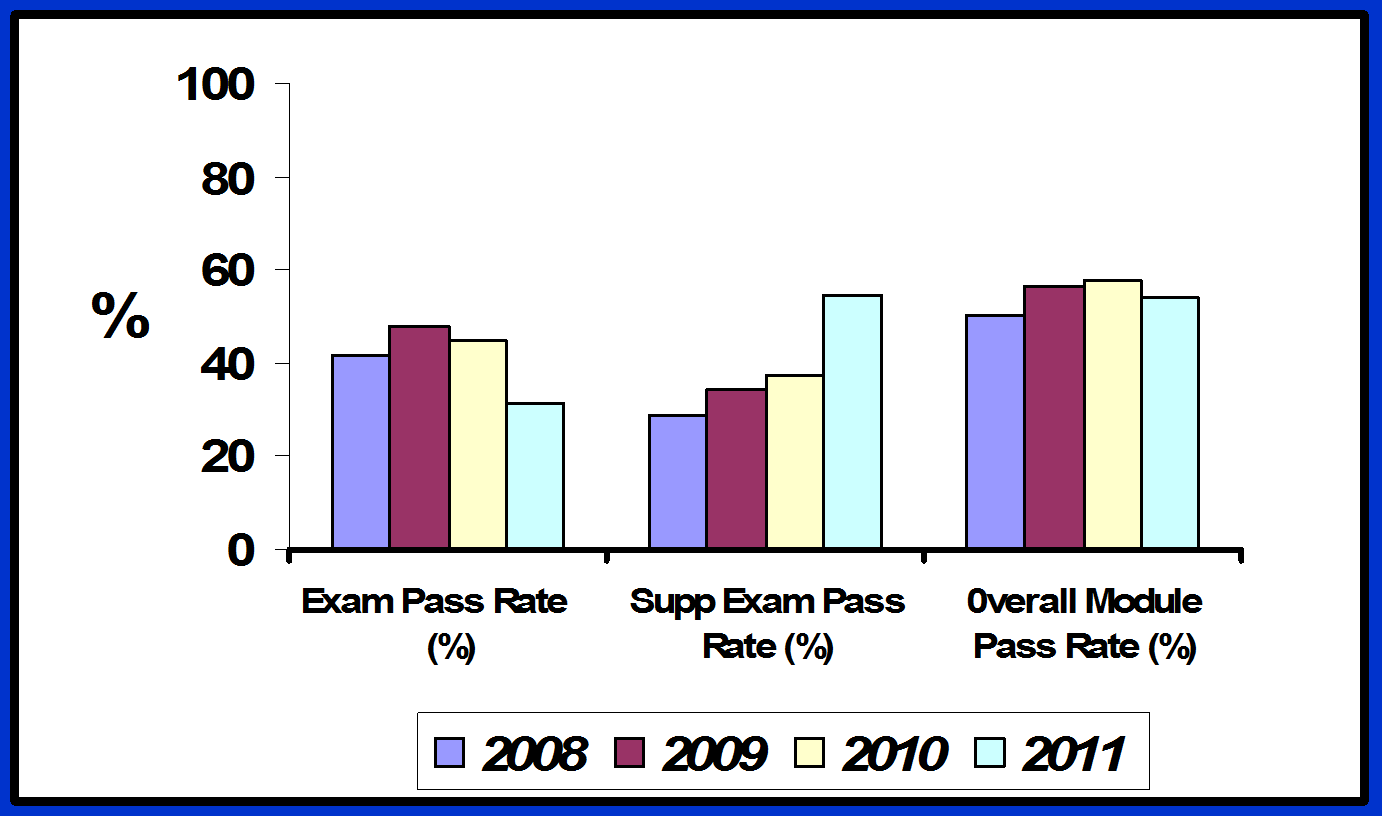
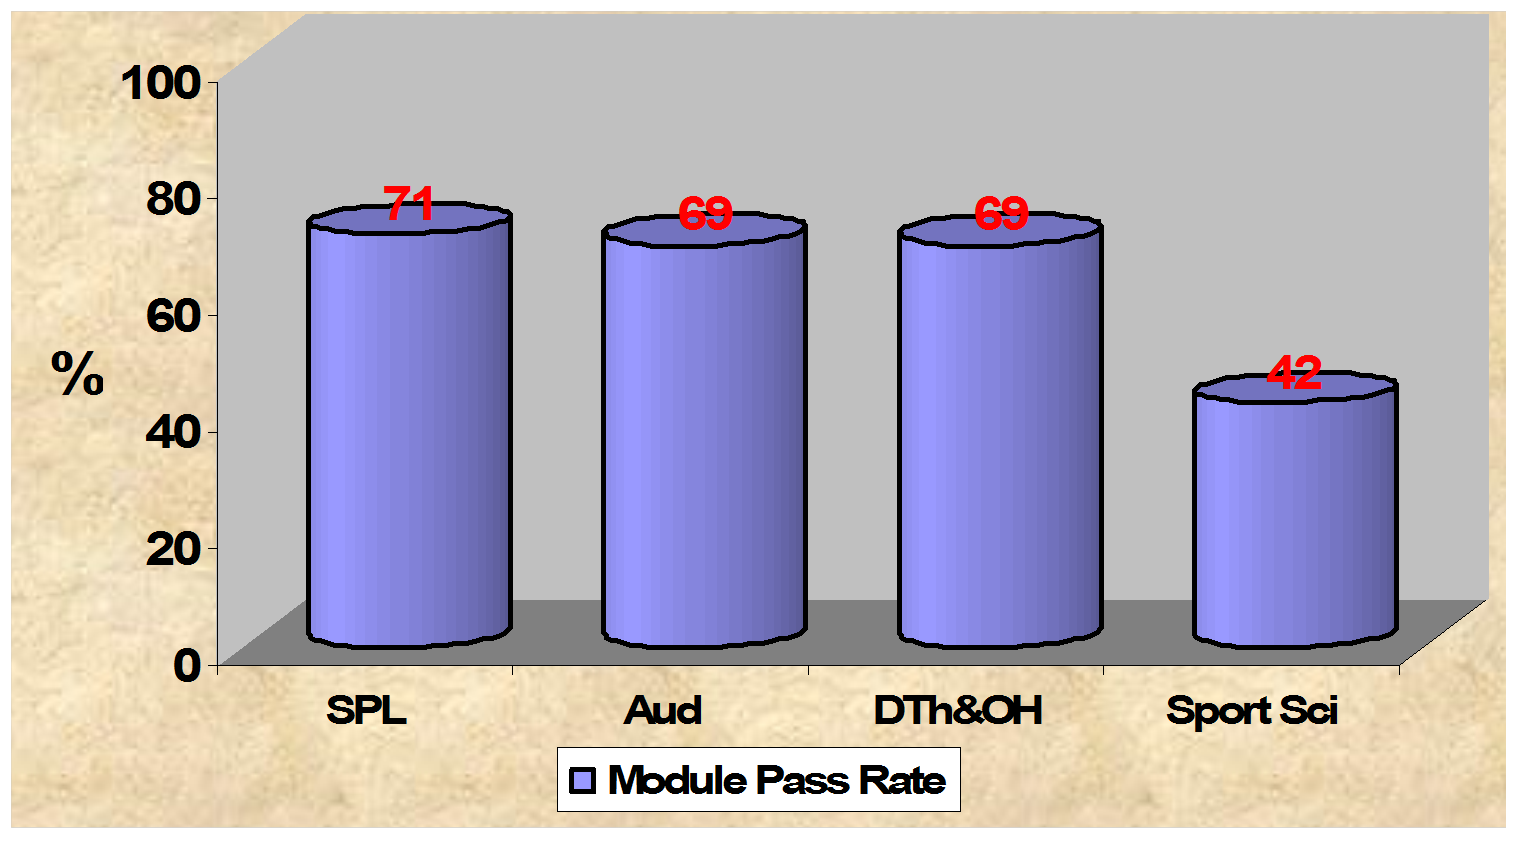
Our research has shown that Health Science (HS) students at UKZN perform  better in their professional as compared to their physiology modules4. Pass rates of physiology modules have tended to be low and have steadily declined, particularly in the first year basic physiology module taken in the first semester (see Figure below).  

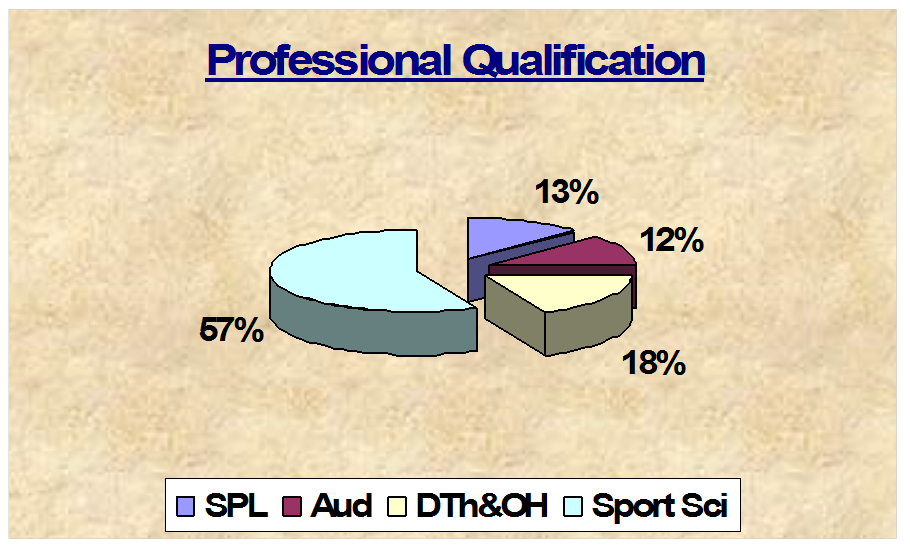
The focus of this study is the first year, first semester  Health Science module, HPHS111. This module is taken by students from 5 different Health Science programmes, namely Audiology (AUD), Dental Therapy (DTH), Speech Language Pathology (SLP), Sport Science (SPS), and Diploma in Oral Health (DIOH).

On-going assessments include 2 Class Tests, 2 Tutorial Test and Practical Reports. These are used to calculate a Semester Mark. The final Module Mark is the sum of the Exam/Supplementary Exam Result + Semester Mark, which is expressed as a %.


 A s ystem does exist at our Institution to detect “students at risk”. However, its activation is dependent on completion of the module. Thus students taking HPHS111 are not flagged until it is too late, unless they are students repeating the course.

There is therefore an urgent need to devise a strategy to identify “struggling” students early on during the semester.

Summary of Work

Ethical Clearance for study was FECHSC 007/10.

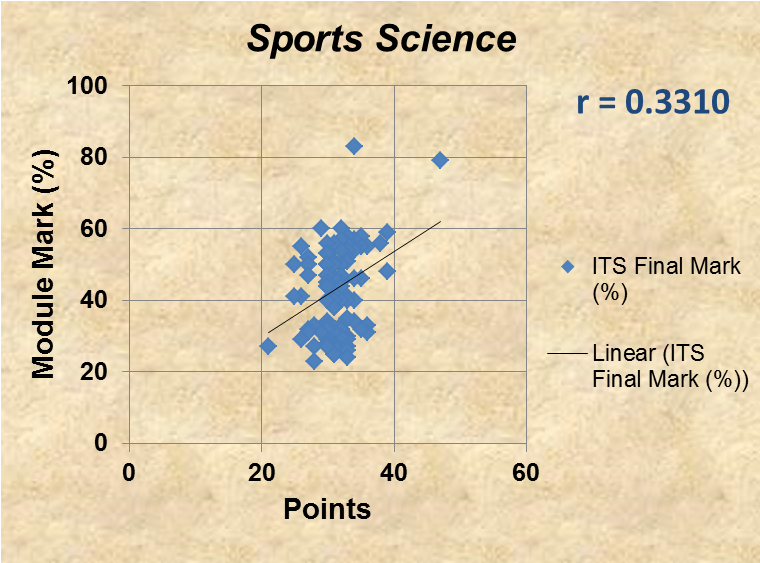
Using biographical data, correlation analyses were undertaken of various performance indicators based on qualification, gender, home language and admission points etc.
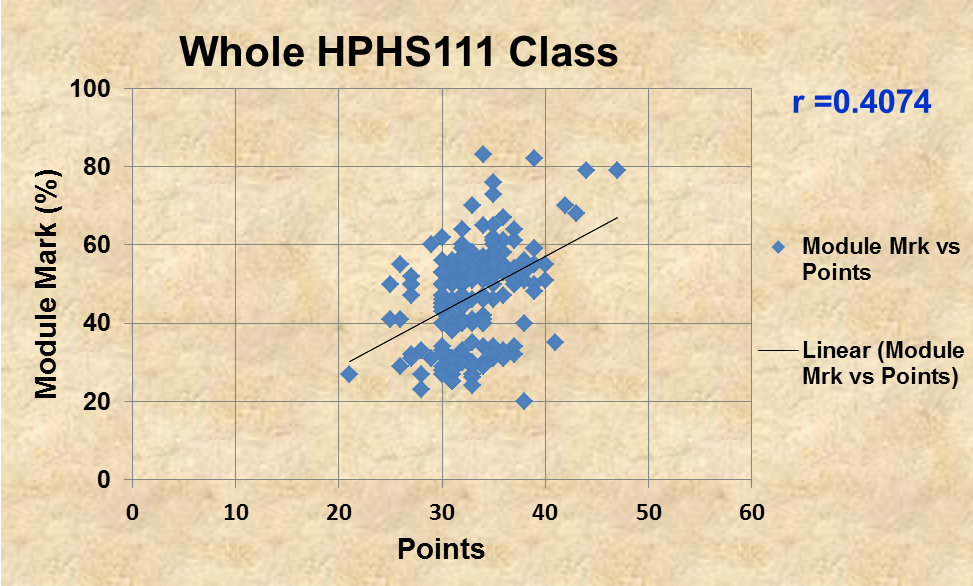
Conclusion

Stu d ent performance in Test 1, not Tut Test 1, was found to be a good predictor of their performance in the module (See Figure below).


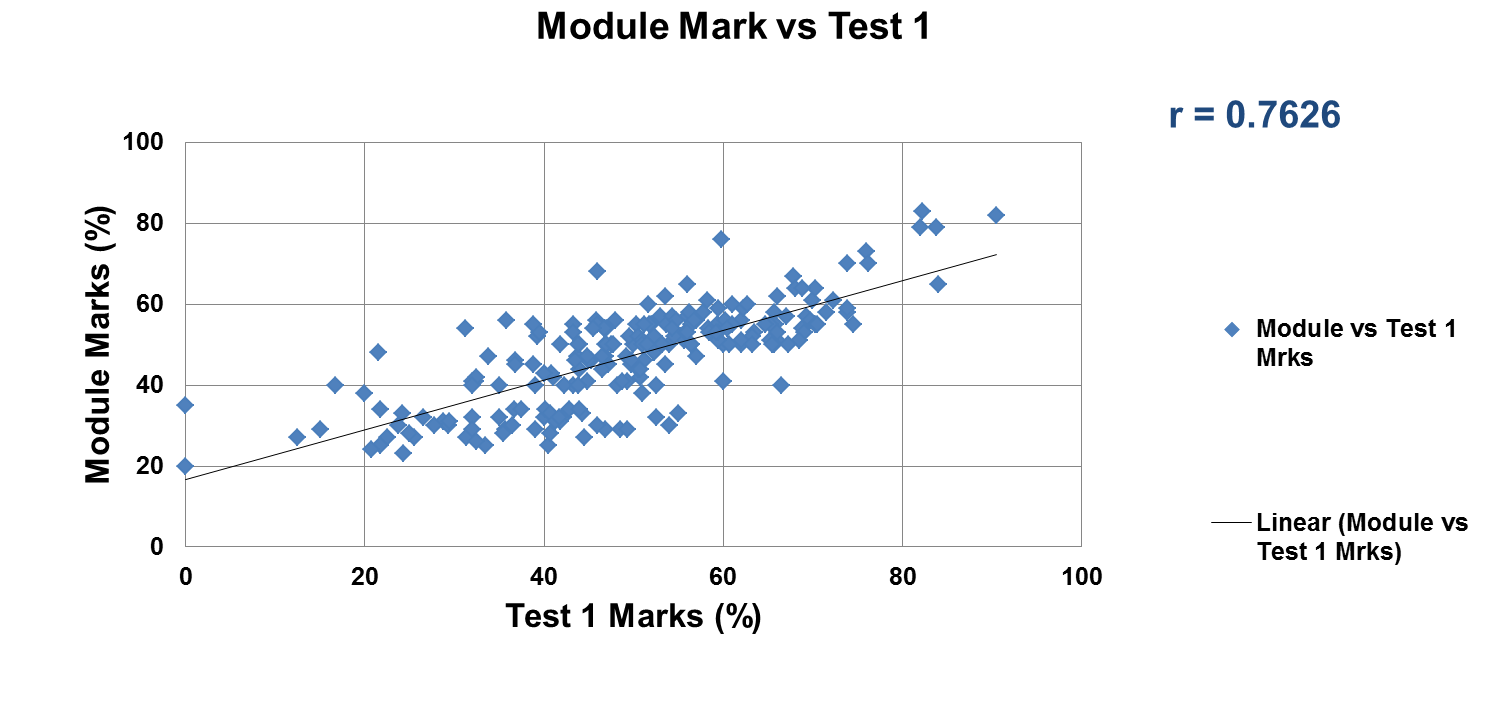
It is also clear that student performance in the first class test is a valuable tool to identify struggling students. Appropriate testing should be held as early as possible.

Take-home Messages

Based on our findings, the following interventions have been implemented:

* All repeating students to be flagged from beginning of Semester

*   All failing students now interviewed by academic development officer  

* All above mentioned students offered & encouraged to attend academic support sessions

* Student motivation and attitude is being addressed in various ways

References
  1. Garrud P, Yates J. Profiling strugglers in a graduate entry medicine course at Nottingham: a retrospective case study. BMC Med Educ 12: 124, 2012 (doi:10.1186/1472-6920-12-124).
  2. Shaban S, McLean M. Predicting performance at medical school: can we identify at-risk students? Advances in Medical Education & Practice 2: 139-148, 2011.
  3. M cLaughin K, Veale P, McIlwrick J, de Groot J, Wright B. A practical approach to mentoring students with repeated performance deficiencies. BMC Medical Education 13: 56, 2013 (doi: 10.1186/1472-6920-13-56).
  4. Higgins-Opitz SB, Tufts M, Naidoo I, Essack S. Perspectives of student performance in the Health Sciences: how do physiology and professional modules compare? South African Journal of Higher Education (in press).
Summary of Results

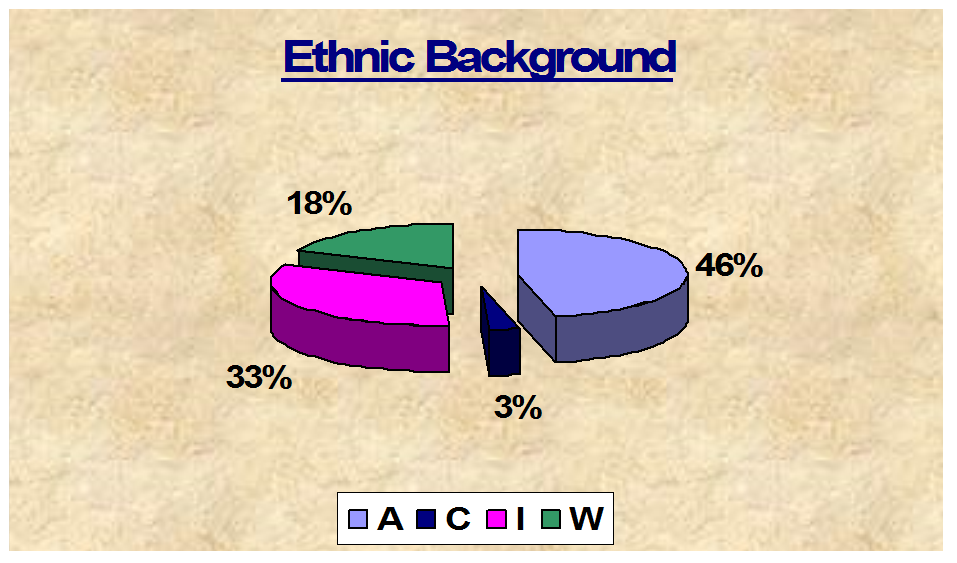
        Demographic Data of 2011 HPHS111 Class (n=214)


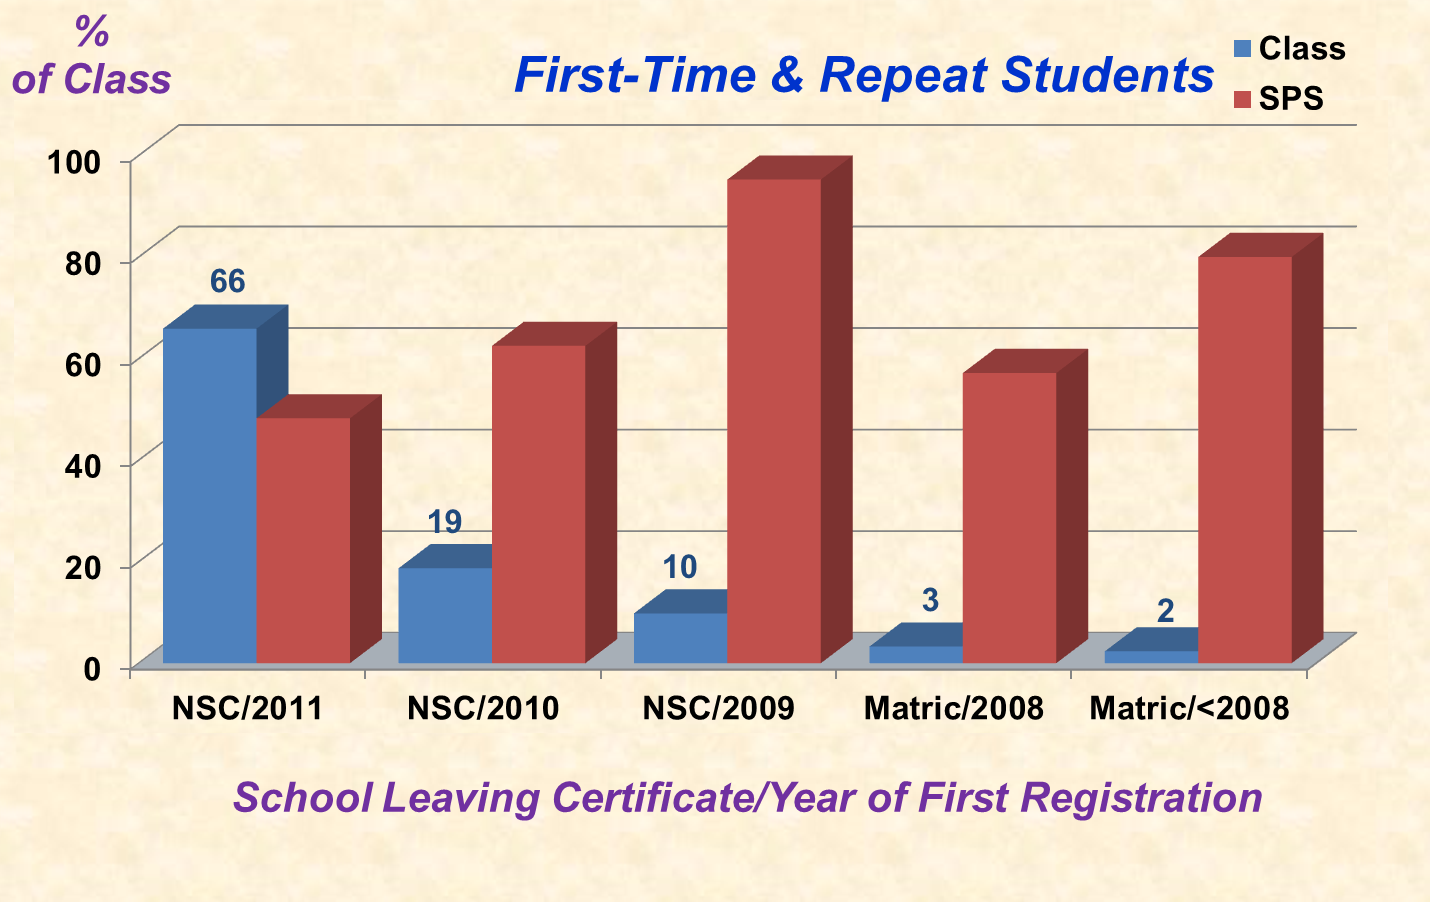
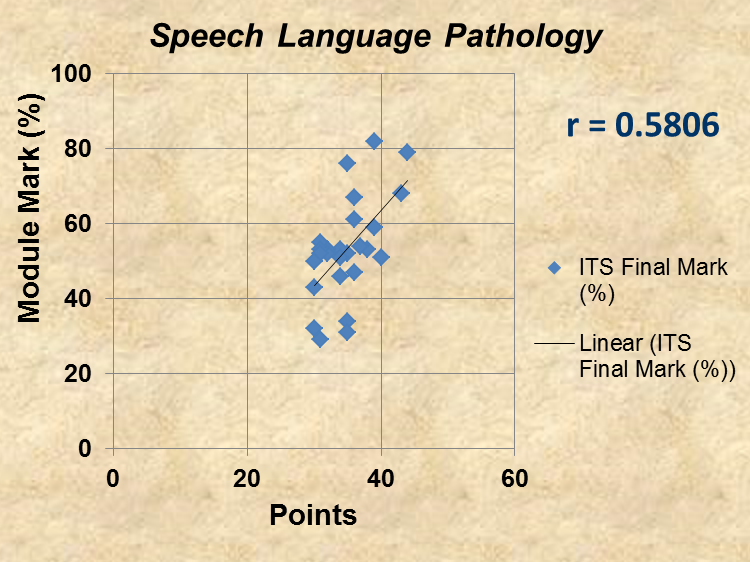
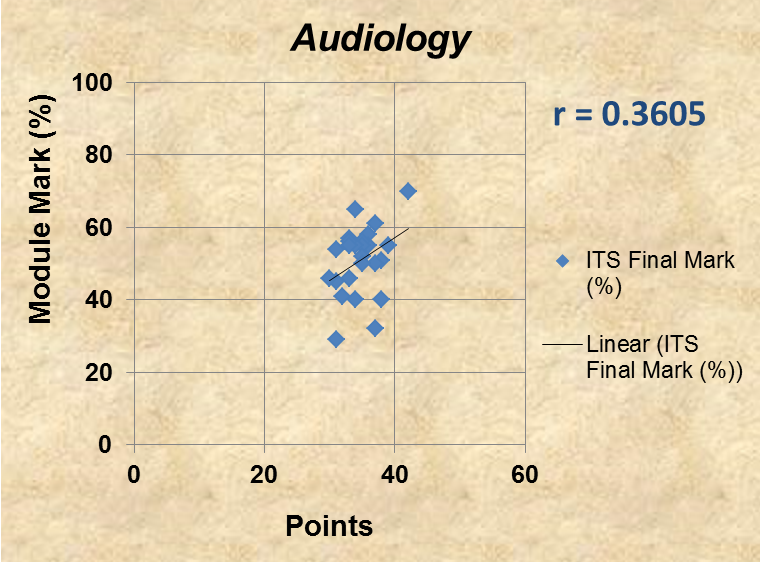
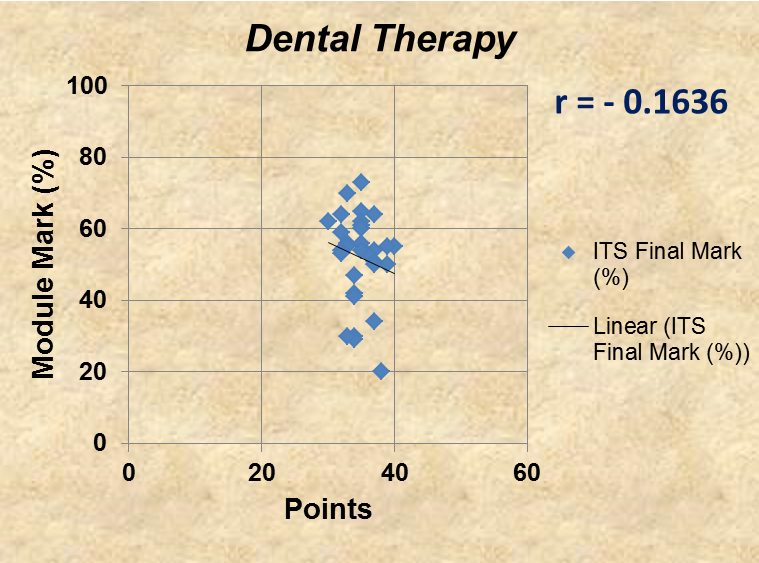
 Correlations were performed in terms of:

1) Gender  2) Qualification  3) Home language  4) Types of Testing 

1

Some examples of the results of the various analyses are illustrated in the Figures below.


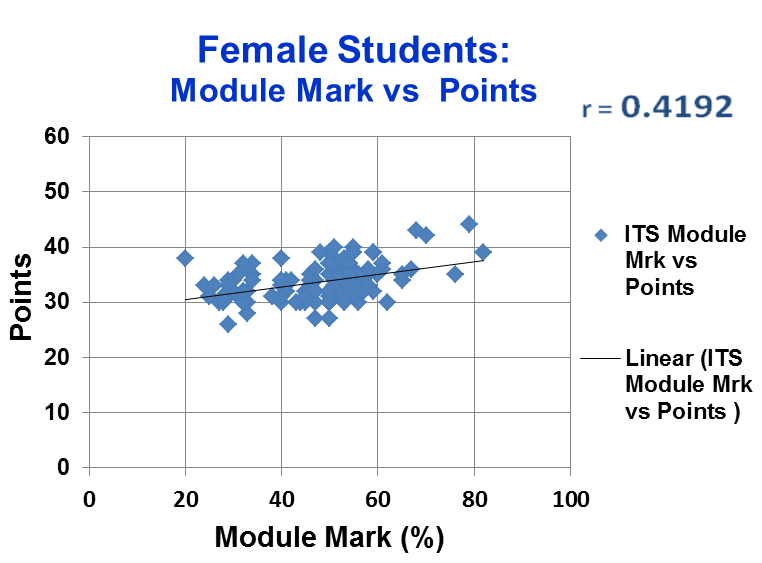
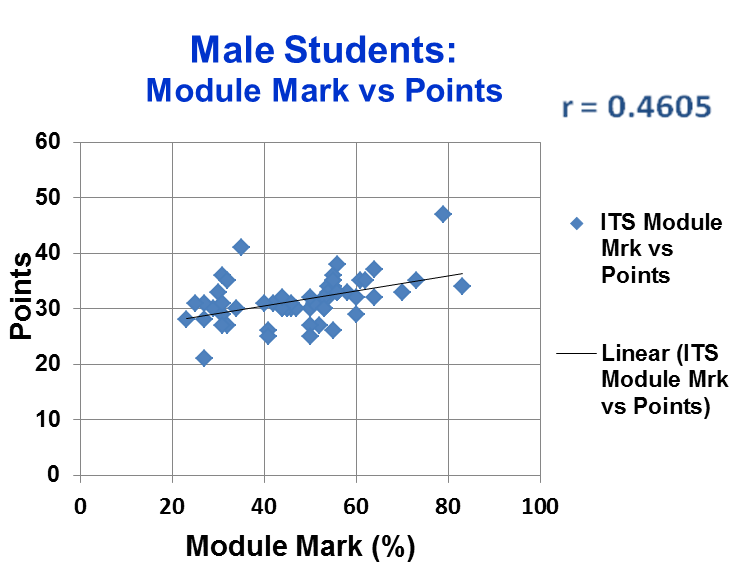
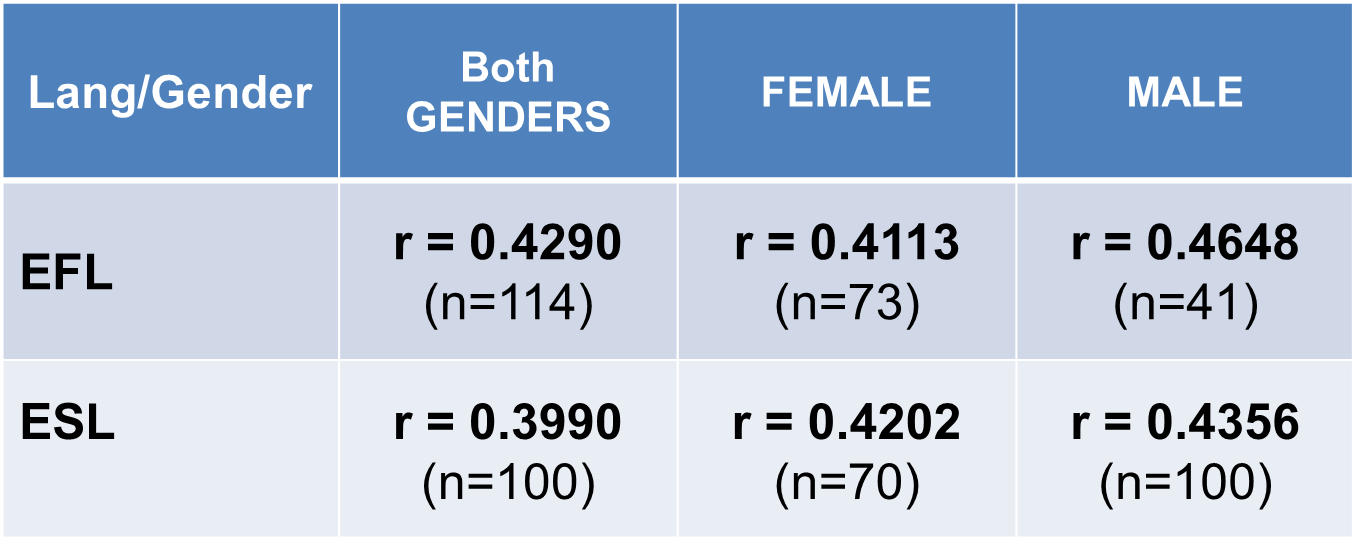
 For types of testing, various correlations and combinations      (i.e. in terms of gender, qualifications, home language) were performed, including

     T ut tests versus module result
Test 1 versus module result
–  Test 1 versus Test 2
–  Test 1 versus Examination results  
Acknowledgement

We would like to thank the 2011 HPHS111 students for their participation in the study and Ms Zodwa Khoza for data entry.

Background
Summary of Work
Conclusion
Take-home Messages
References
Summary of Results

Characteristics of the 2011 HPHS111 Class (N=214)


Characteristics

n (%)/Mean ± S.D (n)

Gender

Female

Male


143 (67%)

  71 (33%)

Home Language

English First Language (EFL)

English Second Language (ESL)


114 (53%)

100 (47%)

Ethnic Group

African

Coloured

Indian

White


99 (46%)

  6 (3%)

70 (33%)

39 (18%)

Professional Qualification

Sport Science (SS)

Dental Therapy and Oral Health (DTH + DIOH)

Speech Language Pathology (SLP)

Audiology (AUD)


121 (57%)

  39 (18%)

  28 (13%)

  26 (12%)

Age

All Students 


According to Qualification

Sport Science (SS)

Dental Therapy and Oral Health (DTH + DIOH)

Speech Language Pathology (SLP)

Audiology (AUD


19 ± 2.2 (214)


20 ± 2.5 (121)

19 ± 1.3 (39)

19 ± 2.2 (28)

18 ± 0.9 (26)

National Senior Certificate (NSC) points

All Students 


According to Qualification

Sport Science (SS)

Dental Therapy and Oral Health (DTH + DIOH)

Speech Language Pathology (SLP)

Audiology (AUD


According to Gender (Sex)

Female

Male


According to English Language

EFL

ESL


According to Race

African

Coloured

Indian

White


33 ± 3.6 (196)


31 ± 3.3 (105)

35 ± 2.6 (39)

35 ± 3.9 (27)

35 ± 2.9 (25)


34 ± 3.2 (135)

32 ± 4.0 (61)


33 ± 4.1 (106)

33 ± 3.0 (90)


33 ± 3.0 (88)

33 ± 4.6 (6)

33 ± 3.7 (65)

33 ± 4.5 (37)

Module Pass Rates (%)

All Students 


According to Qualification

Sport Science (SS)

Dental Therapy and Oral Health (DTH + DIOH)

Speech Language Pathology (SLP)

Audiology (AUD)


54%


42%

69%

71%

69%


Student Performance (mean ± SD) in Selected Assessments according to Qualifications     


Student Performance

Mean ± S.D (n)

Test 1 Results (%)

All Students 


According to Qualification

Sport Science (SS)

Dental Therapy and Oral Health (DTH + DIOH)

Speech Language Pathology (SLP)

Audiology (AUD


According to English Language

EFL

ESL


50 ± 15.2 (213)


47 ± 13.8 (120)

51 ± 20.0 (39)

55 ± 14.6 (28)

53 ± 11.8 (26)


49 ± 15.4 (114)

50 ± 15.1 (99)

Test 2 Results (%)

All Students 


According to Qualification

Sport Science (SS)

Dental Therapy and Oral Health (DTH + DIOH)

Speech Language Pathology (SLP)

Audiology (AUD


52 ± 17.1 (213)


47 ± 15.8 (120)

58 ± 18.0 (39)

61 ± 16.7 (28)

54 ± 14.8 (26)

Semester Mark (%)

All Students 


According to Qualification

Sport Science (SS)

Dental Therapy and Oral Health (DTH + DIOH)

Speech Language Pathology (SLP)

Audiology (AUD


55 ± 12.7 (213)


51 ± 11.5 (120)

58 ± 14.5 (39)

61 ± 13.4 (28)

57 ± 10.1 (26)

Exam Mark (%)

All Students 


According to Qualification

Sport Science (SS)

Dental Therapy and Oral Health (DTH + DIOH)

Speech Language Pathology (SLP)

Audiology (AUD


36 ± 13.6 (199)


32 ± 12.3 (110)

39 ± 13.0 (35)

45 ± 16.0 (28)

38 ± 11.6 (26)

Module Mark (%)

All Students 


According to Qualification

Sport Science (SS)

Dental Therapy and Oral Health (DTH + DIOH)

Speech Language Pathology (SLP)

Audiology (AUD


According to English Language

EFL

ESL


47 ± 12.5 (214)


44 ± 11.8 (121)

50 ± 12.6 (39)

53 ± 13.3 (28)

51 ± 9.3 (26)


47 ± 12.6 (114)

47 ± 12.4 (100)


Results of the statistical correlations performed to identify a reliable predictor of student performance in the module


Correlations Performed#

r-value## (n)

p-value

NSC vs

Test 1 (all students)

Test 2 (all students)

Semester Mark (all students)

Examination (all students)

Module Mark (all students)


NSC according to Gender (Sex)

Module Mark (Female students)

Module Mark (Male students)

NSC according to English Language

Module Mark (EFL students)

Module Mark (ESL students)

NSC According to year of First Registration

Module Mark (1st time students)

Module Mark (Repeat students)

NSC according to Qualification

Module Mark (Audiology)

Module Mark (Speech Language Pathology)

Module Mark (Dental Therapy and Oral Health)

Module Mark (Sports Science)


0.361 (195)

0.327 (195)

0.369 (195)

0.411 (181)

0.397 (196)


0.394 (135)

0.463 (61)


0.382 (106)

0.442 (90)


0.317 (130)

0.392 (66)


0.413 (28)

0.621 (30)

-0.024 (42)

0.273 (108)


0.000

0.000

0.000

0.000

0.000


0.000

0.000


0.000

0.000


0.000

0.001


0.029

0.000

0.882

0.004

Examination (All students) vs

Tutorial Test 1

Test 1

Semester Mark


0.403 (197)

0.703 (198)

0.760 (198)


0.000

0.000

0.000

Module Mark (All students) vs

Tutorial Test 1

Test 1

Test 2

Semester Mark

Examination


0.378 (211)

0.751 (212)

0.780 (213)

0.834 (215)

0.835 (199)


0.000

0.000

0.000

0.000

0.000

Module Mark (Sport Science students) vs

Tutorial Test 1

Test 1

Test 2

Semester Mark

Examination


0.359 (119)

0.702 (120)

0.723 (120)

0.793 (120)

0.887 (110)


0.000

0.000

0.000

0.000

0.000

# Spearman’s correlation analysis was performed

## Spearman’s rho where guidelines suggest that r<0.6 no linear correlation; 0.6  r>0.8 strong correlation

Acknowledgement
Send ePoster Link